做一个基于 R 语言的环形热图(Circos Heatmap)绘制工具,通过 Aardio 实现图形界面。
项目地址:CircosHeatmap-aardio
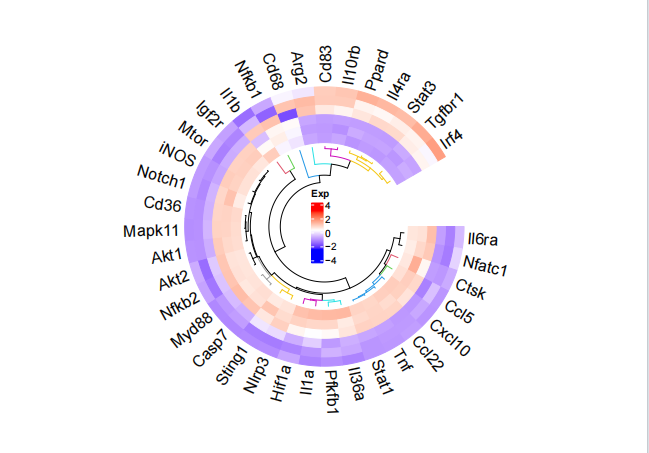
示例:
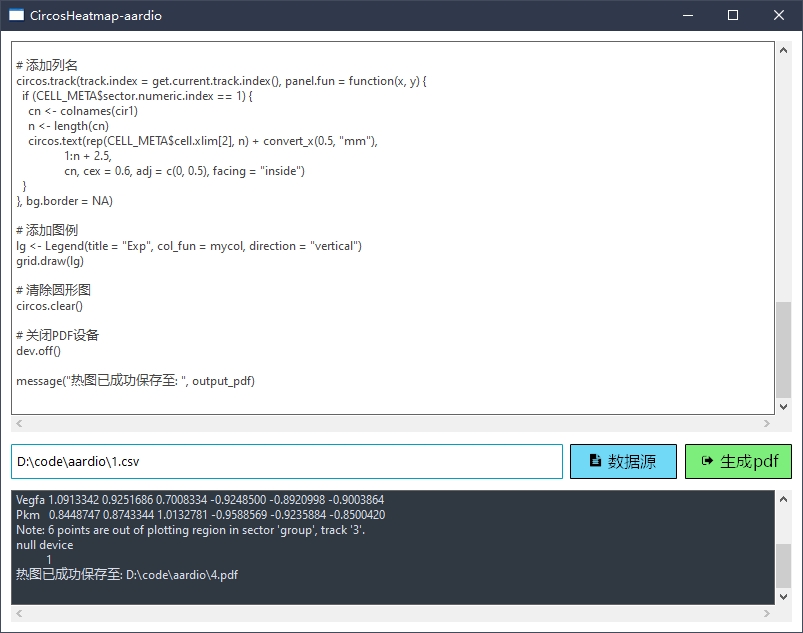
输出:
编译打包前的准备:
修改 aardio\lib\process\r\_.aardio 文件中:
setLibPaths({..io.appData("aardio/std/r/site-library")});修改为
	if (_STUDIO_INVOKED) {
    	// 开发环境
    	setLibPaths({..io.appData("aardio/std/r/site-library")});
	} else {
    	// 打包后环境
    	setLibPaths({"lib\r-library"});
	}
修改它的目的:初次接触 aardio + R 的开发,安装 R 的相关库时遇到无法安装部分 R 库的问题,所以干脆把安装好的 R 相关库放入程序根目录下,便于将程序分发给别人使用。
这样做缺点:R 库体积偏大,100MB+,不过真正需要的人应该不在乎体积吧
TODO:
1、aardio 图形界面开发
import win.ui;
/*DSG{{*/
mainForm = win.form(text="CircosHeatmap-aardio";right=800;bottom=600)
mainForm.add(
btnRun={cls="plus";text="运行";left=740;top=10;right=791;bottom=41;activebgcolor=19354;bgcolor=-5197169;font=LOGFONT(h=-16);hoverbgcolor=23477;textcolor=16777215;z=4};
btnSelectFile={cls="plus";text="选择输入文件";left=608;top=10;right=732;bottom=41;activebgcolor=19354;bgcolor=-5197169;font=LOGFONT(h=-16);hoverbgcolor=23477;textcolor=16777215;z=3};
editConsole={cls="edit";left=10;top=467;right=791;bottom=591;bgcolor=16777215;db=1;dl=1;dr=1;edge=1;hscroll=1;multiline=1;textcolor=0;vscroll=1;z=1};
editRScript={cls="edit";left=10;top=48;right=791;bottom=451;bgcolor=16777215;db=1;dl=1;dr=1;dt=1;edge=1;hscroll=1;multiline=1;textcolor=0;vscroll=1;z=5};
inputFile={cls="edit";left=10;top=10;right=600;bottom=40;bgcolor=16777215;edge=1;textcolor=0;z=2}
)
/*}}*/

btskin = {
	background={
		active=0xFFD3E0BC;
		default=0xFF8FB2B0;
		hover=0xFF928BB3
	}
}
mainForm.btnRun.skin(btskin);
mainForm.btnSelectFile.skin(btskin);

import console;
import process.r;
import fsys.dlg;

mainForm.editRScript.print($"\res\heatmap_script.R");

// 选择文件按钮点击事件
mainForm.btnSelectFile.oncommand = function(id, event) {
    var filePath = fsys.dlg.open("CSV 文件|*.csv||",, "选择输入文件");
    if (filePath) {
        mainForm.inputFile.text = filePath; // 将选择的文件路径显示在输入框中
    }
}

// 运行按钮点击事件
mainForm.btnRun.oncommand = function(id, event) {
    var inputFilePath = mainForm.inputFile.text;
    if (!inputFilePath) {
        console.log("请先选择输入文件!");
        return;
    }

    // 弹出保存文件对话框,选择PDF保存路径
    var outputFilePath = fsys.dlg.save("PDF 文件|*.pdf||",, "选择保存路径");
    if (!outputFilePath) {
        console.log("请选择PDF文件的保存路径!");
        return;
    }

    // 执行 R 脚本
    var out = process.r.exec(mainForm.editRScript.text, inputFilePath, outputFilePath);
    mainForm.editConsole.print(out);
}

// 显示主窗口
mainForm.show();
return win.loopMessage();
2、 R 脚本实现
R 脚本是该程序的核心,负责数据处理和环形热图的绘制。
# 加载所需的包
suppressPackageStartupMessages(library(circlize))
suppressPackageStartupMessages(library(RColorBrewer))
suppressPackageStartupMessages(library(ComplexHeatmap))
suppressPackageStartupMessages(library(dendextend))

# 获取命令行参数
args <- commandArgs(trailingOnly = TRUE)

# 检查参数数量
if (length(args) != 2) {
  stop("请提供两个参数:输入CSV文件路径和输出PDF文件路径。", call. = FALSE)
}

# 获取输入CSV文件路径和输出PDF文件路径
input_csv <- args[1]
output_pdf <- args[2]

# 检查输入文件是否存在
if (!file.exists(input_csv)) {
  stop("输入文件不存在。请检查文件路径。", call. = FALSE)
}

# 函数加载和预处理数据
load_and_preprocess_data <- function(file_path) {
  data <- read.table(file = file_path, header = TRUE, row.names = 1, sep = ',')
  data_matrix <- as.matrix(data)
  normalized_data <- t(scale(t(data_matrix)))
  normalized_data[is.na(normalized_data)] <- 0
  return(normalized_data)
}

# 加载和预处理数据
cir1 <- load_and_preprocess_data(input_csv)

# 打印数据维度和头部
print(dim(cir1))
print(head(cir1))

# 定义颜色梯度
mycol <- colorRamp2(c(-2.5, 0.3, 3.1), c("blue", "white", "red"))

# 打开PDF设备,设置宽度和高度相等
pdf(output_pdf, width = 8, height = 8)

# 设置绘图参数
circos.par(gap.after = c(30))

# 绘制调整后的圆形热图
circos.heatmap(cir1,
                col = mycol,
                dend.side = "inside",
                rownames.side = "outside",
                rownames.col = "black",
                rownames.cex = 1.3,
                track.height = 0.35,  # 增加轨道高度
                cluster = TRUE,
                dend.track.height = 0.18,
                dend.callback = function(dend, m, si) {
                  color_branches(dend, k = 15, col = 1:15)
                })

# 添加列名
circos.track(track.index = get.current.track.index(), panel.fun = function(x, y) {
  if (CELL_META$sector.numeric.index == 1) {
    cn <- colnames(cir1)
    n <- length(cn)
    circos.text(rep(CELL_META$cell.xlim[2], n) + convert_x(0.5, "mm"),
                1:n + 2.5,
                cn, cex = 0.6, adj = c(0, 0.5), facing = "inside")
  }
}, bg.border = NA)

# 添加图例
lg <- Legend(title = "Exp", col_fun = mycol, direction = "vertical")
grid.draw(lg)

# 清除圆形图
circos.clear()

# 关闭PDF设备
dev.off()

message("热图已成功保存至: ", output_pdf)

